The American Trends Panel survey methodology
The American Trends Panel (ATP), created by Pew Research Center, is a nationally representative panel of randomly selected U.S. adults. Panelists participate via self-administered web surveys. Panelists who do not have internet access at home are provided with a tablet and wireless internet connection. Interviews are conducted in both English and Spanish. The panel is being managed by Ipsos.
Data in this report is drawn from the panel wave conducted Aug. 31 to Sept. 7, 2020. A total of 9,220 panelists responded out of 9,810 who were sampled, for a response rate of 94%. This does not include two panelists who were removed from the data due to extremely high rates of refusal or straightlining. The cumulative response rate accounting for nonresponse to the recruitment surveys and attrition is 5%. The break-off rate among panelists who logged on to the survey and completed at least one item is 1%. The margin of sampling error for the full sample of 9,220 respondents is plus or minus 1.7 percentage points. The survey is weighted to be representative of the U.S. adult population by gender, race, ethnicity, partisan affiliation, education and other categories.
More information about this wave of the American Trends Panel can be found here.
Content analysis
Researchers conducted their analysis on a collection of 9,220 raw responses to the following open-ended survey questions:
Before we finish the survey, we’re interested in getting a deeper understanding of how people have been experiencing the coronavirus outbreak, and how it might have impacted them in both negative and positive ways. Please take a moment to reflect on how the outbreak has affected your own life, and then answer the next two questions in as much detail as you can.
- Thinking about how things have been going in your life since the beginning of the coronavirus outbreak, in what ways, if any, have things been difficult or challenging for you personally?
- Thinking about how things have been going in your life since the beginning of the coronavirus outbreak, what, if anything, have been some positive aspects of the situation for you personally?
The two questions were asked in a random order. Overall, 84% of respondents (8,143) provided an answer to one or both of the questions (the 16% of respondents that skipped both questions are not included in this analysis). From these responses, researchers drew a half-sample of 4,071 responses to assess and analyze their content. Responses that were written in Spanish – 3% of the sample – were machine translated and examined by researchers to confirm their interpretability.
After drawing exploratory samples to identify common themes in the responses, researchers developed a codebook to measure the different types of positive and negative changes. Coders were shown respondents’ answers to both the positive and negative questions side-by-side, prefixed by “POSITIVE:” and “NEGATIVE:” labels to indicate the prompt that elicited each response. Coders were instructed to first indicate whether each response mentioned any positive and/or negative changes, and then to mark those that fell into any of six different categories: relationships; free time or activities; work situation; economics; physical or mental health; and society, politics, safety precautions or rules. Additional instructions and rules were provided to help coders make their decisions. Two in-house researchers iteratively drew and coded samples and expanded the codebook rules until acceptable inter-rater reliability was achieved.
Codebook
We asked two questions on a recent survey, one about negative impacts of the pandemic, and another about unexpectedly positive effects. The ‘POSITIVE’ and ‘NEGATIVE’ labels below indicate how a respondent answered each question, but they may have mentioned positive things when answering the negative question, and vice versa. Please use the labels as a guide – if they don’t provide additional context for their response, you can assume that it’s answering the question that was asked. If they give more details, use that to help make your decision.
- “NEGATIVE: more time at home: – assume this is a negative thing
- “NEGATIVE: work has been challenging, but I have more time at home” – they mention work as a negative thing, but time at home is a positive thing
Only mark something if it is a change or difference in their life; if they mention something that has stayed the same (“My family has stayed healthy,” “I’m still broke and unemployed”) do not count it.
NOTE: the POSITIVE and NEGATIVE prompt markers in the responses are guides. Just because respondents wrote something, doesn’t mean what they wrote matched the prompt – read the responses carefully when answering this. Any positive changes mentioned in either prompt counts as specifics, even if they aren’t captured by any of the checkbox categories below.
POSITIVE CHANGES: Does this response mention any specific positive changes during the pandemic?
RELATIONSHIPS: quality/frequency of social interactions (themselves)
- Spending more time with family/friends/neighbors
- Growing closer to others/developing better relationships
- Enjoying not having to socialize as much
- DO NOT COUNT church unless a social aspect is mentioned
- DO NOT COUNT spending time with pets
FREE TIME/ACTIVITIES: Free time, activities or hobbies
- Having more free time/more time to do things around the house
- Being able to do more things/spending more time doing things at home
- Picking up new activities or hobbies
- Learning new things
- Less time spent on unfulfilling activities like driving (WORK SITUATION)
- Slowing down/having a slower pace of life/being able to relax more (PHYSICAL/MENTAL HEALTH)
- Enjoying spending (more) time at home
- Having more time for personal reflection (PHYSICAL/MENTAL HEALTH)
- DO NOT COUNT socializing or seeing/visiting people unless it mentions a specific activity like ‘going out’ or ‘traveling’
- USE THE PROMPTS AS CONTEXT: ‘more time at home’ under the POSITIVE prompt would count, but under the NEGATIVE one it would not
WORK SITUATION: quality or availability of job/work/career (themselves or people they know)
- Being able to work from home
- Having an improved work situation
- Having a better work-life balance
- Finding a new job
- Not having to go into the office
- Not having a commute (FREE TIME/ACTIVITIES)
- Not having to work as much
- Success maintaining their business
- Used the situation as an opportunity to retire or do something different
ECONOMICS: Finances, money or economics (in any sense)
- Saving more money/spending less money
- Receiving stimulus or unemployment funds/having an increase in income
- Feeling like the economy is doing well
PHYSICAL/MENTAL HEALTH: mental or physical health outcomes, conditions or behaviors (themselves or people they know)
- Slowing down/having a slower pace of life/being able to relax more (FREE TIME/ ACTIVITIES)
- Feeling happier or more relaxed/less stressed/more content
- Having more time for personal reflection (FREE TIME/ACTIVITIES)
- Improved spiritual life/greater spirituality
- Greater appreciation for things that are important/having greater clarity
- Feeling a renewed sense of gratitude for what they have
- Paying more attention to their health/being in better health/losing weight
- Doing healthy activities like exercising, walking, hiking, eating better, getting more sleep
- Doing fewer unhealthy activities/drinking less
SOCIETY/POLITICS/SAFETY PRECAUTIONS/RULES: views on politics, social conditions, safety precautions like wearing masks, and/or rules and regulations
- Approves of government response to the pandemic/explicitly expresses support for safety precautions/rules/regulations/restrictions
- Expresses satisfaction with or support for certain political groups/views
- Positive developments in society like: people practicing better hygiene, following safety precautions, less pollution, less traffic, places being less crowded, positive environmental developments
- Expresses satisfaction with increased awareness of social/political issues/the ‘truth’ being exposed
- DO NOT COUNT simple mentions of following safety precautions/rules; they need to clearly mention it as a positive thing that they support
- DO NOT COUNT appreciating essential workers
NEGATIVE CHANGES: Does this response mention any specific negative changes during the pandemic?
RELATIONSHIPS: quality/frequency of social interactions
- Not being able to socialize, see or visit people/diminished social life/fewer social interactions
- Deteriorating relationships/increased conflict
- Lack of physical contact with others
- The death of family members or friends (PHYSICAL/MENTAL HEALTH)
- The specific feelings of isolation or loneliness (PHYSICAL/MENTAL HEALTH)
- DO NOT COUNT church unless a social aspect is mentioned
FREE TIME/ACTIVITIES: Free time, activities or hobbies
- Not being able to do things they used to do or were planning on doing (e.g. shopping, church, travel, events, vacations, appointments)
- Feeling pent up/having cabin fever/being stuck at home
- Having too much free time/feeling bored
- Not having enough free time
- Not being able to go to church/missing church
- DO NOT COUNT not being able to socialize or see/visit people unless it mentions a specific activity like ‘going out’ or ‘traveling’
- USE THE PROMPTS AS CONTEXT: ‘more time at home’ under the NEGATIVE prompt would count, but under the POSITIVE one it would not
WORK SITUATION: quality or availability of job/work/career (themselves or people they know)
- Having to work from home
- Job insecurity/feeling uncertain about their employment
- Losing their job/complaining about not having a job/not enough work/having their hours or pay cut/having less work available/getting furloughed (ECONOMIC)
- Having to go to work (being an essential worker)
- More stress at or about work/feeling unsafe at work
- Being forced to retire
- DO NOT COUNT general unemployment or generic references to people losing their jobs or being out of work (that would be ECONOMIC instead)
- DO NOT COUNT not having enough money unless it mentions a pay reduction or loss of income
ECONOMICS: Finances, money or economics (in any sense)
- Losing their job/complaining about not having a job/not enough work/having their hours or pay cut/having less work available/getting furloughed (WORK SITUATION)
- General unemployment or generic references to people losing their jobs or being out of work
- Negative impacts on the economy or small businesses/business closing/general poor health of the economy
- Spending more money
- Having less income/paycheck reductions
- Running out of money
- More financial uncertainty
- Product shortages or scarcity
- DO NOT COUNT references to ‘job insecurity’ or other work-related issues unless there is a clear and obvious economic impact (i.e. job loss or one of the other specific topics mentioned above)
PHYSICAL/MENTAL HEALTH: mental or physical health outcomes, conditions or behaviors (themselves or people they know)
- Not being able to get healthcare/avoiding healthcare or doctors
- Being in worse health than they were before/gaining weight
- Doing unhealthy activities like drinking more
- Doing fewer healthy activities like exercising, walking or hiking
- Eating poorly/gaining weight
- Not being able to exercise or go to the gym
- The death of family members or friends (RELATIONSHIPS)
- Clearly expresses concern or worry about being at-risk for COVID or getting COVID/worried about pre-existing condition
- Not feeling safe
- Someone specific (themselves or someone they know) being or getting sick or dying, COVID or otherwise
- The specific feelings of isolation or loneliness (RELATIONSHIPS)
- Feeling mentally taxed/feeling like they can’t enjoy life
- Describes feeling stressed, depressed, afraid, angry, sad, frustrated or worried
- DO NOT COUNT statements that sound angry or depressed etc; they need to mention a mental/emotional state or feeling a certain way emotionally
DO NOT COUNT statements that describe careful behavior (e.g. ‘we are being cautious’) or simple mentions of pre-existing conditions (e.g. ‘we are at risk’) unless they specifically mention being worried, anxious, afraid, etc.
SOCIETY/POLITICS/SAFETY PRECAUTIONS/RULES: views on politics, social conditions, safety precautions like wearing masks, and/or rules and regulations
- Feeling like they’re being lied too/not trusting the ‘truth’
- Expresses disapproval of certain political groups/views
- Expresses frustration with or skepticism of safety precautions/masks/rules/regulations/restrictions/lockdowns/curfews
- Disapproves of government response to the pandemic
- Negative developments in society like people not following safety precautions or not taking the virus seriously, more partisan conflict, people being rude
- Negative views of certain public figures or institutions like politicians, the media, or scientists
- Feeling stigmatized or judged for their views
- Being sequestered/being on mandatory lockdown
- Thinking the virus is overblown and that things should get back to normal
- INCLUDES mentions of safety precautions like masks and social distancing or mention of rules/restrictions/lockdowns/curfews if they appear under the NEGATIVE prompt, unless additional context suggests otherwise
- DO NOT COUNT generic reference to ‘quarantine’ if they’re just using it to refer to the general pandemic situation
- Final inter-rater reliability between the two in-house coders, as measured by Cohen’s Kappa, is reported below for a final sample of 200 responses. The frequency of each category and the size of the sample was sufficient to determine with 95% confidence that the true Kappa values for each category are at least 0.7.
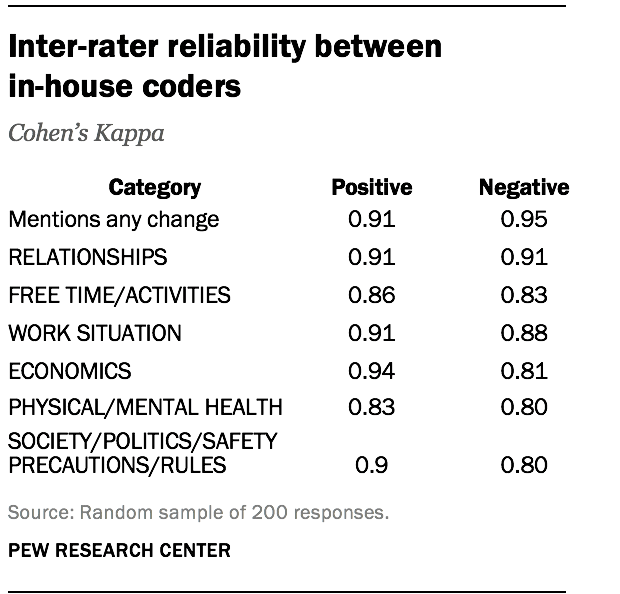
Final inter-rater reliability between the two in-house coders, as measured by Cohen’s Kappa, is reported below for a final sample of 200 responses. The frequency of each category and the size of the sample was sufficient to determine with 95% confidence that the true Kappa values for each category are at least 0.7.
Before conducting the full content analysis, researchers separated the responses into two groups: those that contained potentially sensitive personal details, and those that did not. In-house researchers then coded 360 responses that did contain such information, and used Amazon’s Mechanical Turk service to code the remaining 3,711 that did not. Three Mechanical Turk workers coded each response, and their decisions were collapsed using a two-out-of-three consensus threshold to produce coding decisions comparable to those of our own in-house researchers.
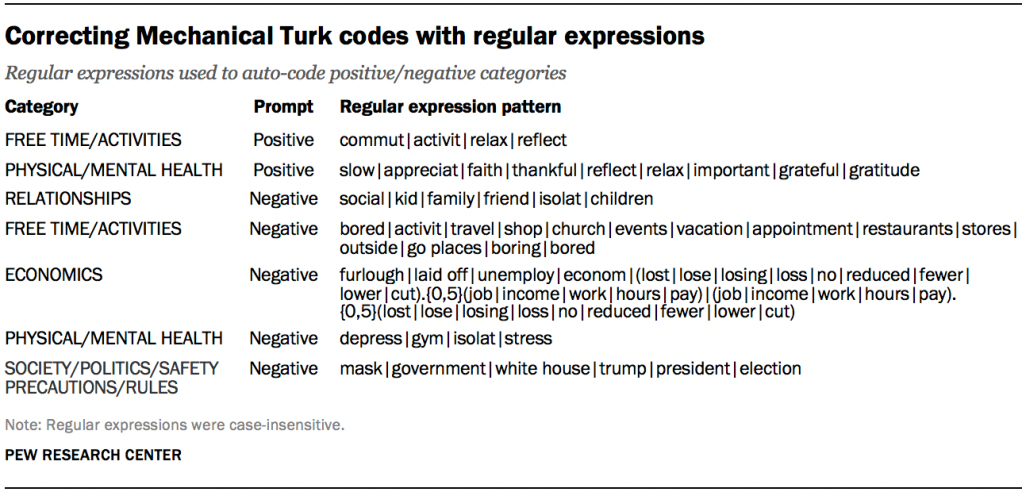
To assess this inter-rater reliability, in-house researchers coded a subset of the responses that were sent to Mechanical Turk. A review of initial results showed promising reliability but also indicated that Mechanical Turk workers were often missing some of the more nuanced coding rules. These mistakes were consistent and obvious; for example, Mechanical Turk workers were successfully identifying negative changes related to physical health, but appeared to be commonly missing responses that described negative mental health changes such as depression and stress. After noticing these patterns, researchers were able to develop a handful of pattern-matching rules to make corrections to the Mechanical Turk workers’ decisions based on whether specific keywords (e.g., “depress” or “stress”) were mentioned in the positive or negative section of each response’s text.
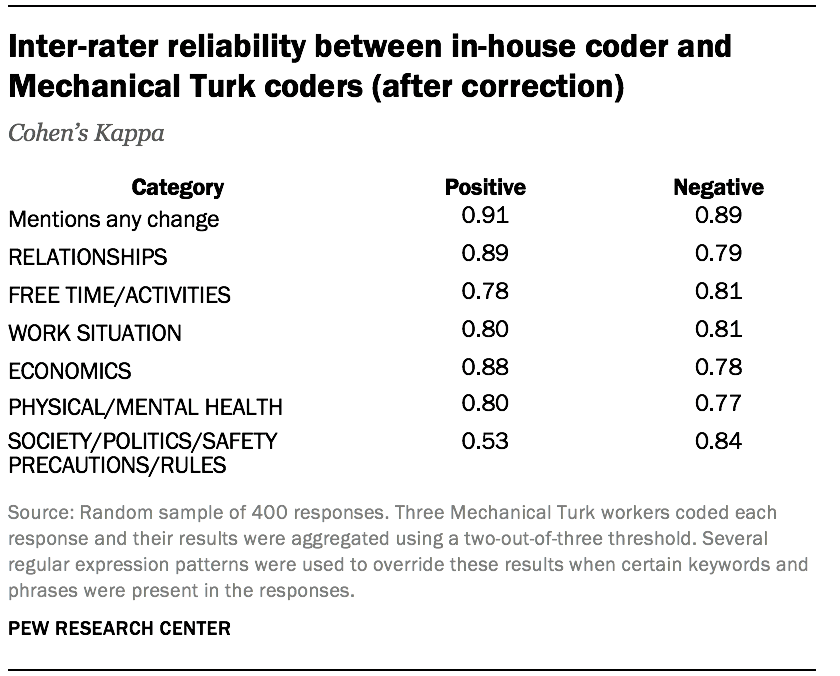
After coding a final expanded sample of 400 responses, researchers determined that this combined Mechanical Turk and pattern-matching approach produced results comparable to our own in-house decisions, with the exception of positive changes related to society, politics, safety precautions and rules.
For the final analysis, researchers combined the 360 responses that were coded in-house with the 3,711 responses that were coded by Mechanical Turk workers, for a final sample of 4,071 responses. Fully 95% of these responses mentioned at least one positive or negative change; 67% mentioned at least one of each, 22% mentioned one or more negative changes but no positive changes, and 5% mentioned one or more positive changes but no negative ones.
Demographic differences
All reported demographic differences were confirmed to be statistically significant with 95% confidence using logistic regressions that isolated the relationships between demographic factors and a respondent’s likelihood of mentioning a positive or negative change in each category. The regression models included variables for race/ethnicity, political party identification, education, age, urbanicity, parenthood, income, gender, geographic region and language (English vs. Spanish), and also controlled for the overall length of each responses using log-scaled word counts.

